|
INTRODUCTION
The SIA Group�s unaudited results for the six months ended 30 September
2000 were released on 27 October 2000. A summary of the financial and
operating statistics for the period under review is shown in Annex A.
All monetary figures are in Singapore Dollars.
EARNINGS
With sustained economic recovery in key Asian markets, the Company�s
operating profit for the six months ended 30 September 2000 increased by
$194 million (+52.0%) from the same period in 1999, to $569 million.
Revenue was $666 million higher (+16.9%) at $4,615 million, while
expenditure grew by $472 million (+13.2%) to $4,046 million, mainly from
the escalation in fuel costs (+$296 million or 57.8%). Rising fuel
prices were partially mitigated by hedging gains and a young aircraft
fleet.
The Company�s profit before tax was $1,212 million, up $567 million
(+88.0%) after the inclusion of:-
(i) a surplus of $58 million from the sale and leaseback of one B747-400
passenger aircraft, the trade-in of one A310-200 aircraft, the sale and
leaseback of six A340-300 spare engines, and the sale of spares and
other spare engines;
(ii) lower gross dividends from subsidiaries and associated companies of
$10 million [Singapore Airport Terminal Services Limited (SATS) and SIA
Engineering Company (SIAEC) did not pay a final dividend for financial
year 1999-2000, but a special dividend was paid in March 2000 totalling
$371 million as part of a capital restructuring prior to their initial
public offerings (IPOs) on 5 May 2000]; and
(iii) a profit of $575 million on disposal of vendor shares representing
13.0% equity interests in SATS and SIAEC. At Group level, the profit
from the IPOs amounted to $440 million after deducting 13% of the net
tangible assets of SATS and SIAEC as at 5 May 2000 from the net proceeds
of sale.
In the same period in 1999, there were (i) a surplus of $47 million
realised from the sale and leaseback of two B747-400 passenger aircraft,
and the sale of spares and spare engines, and (ii) a profit of $111
million on disposal of the entire investments in Delta Air Lines (DL)
and Swissair (SR). If the profits from the IPOs in the current year and
the sale of investments in DL and SR in 1999 were excluded, profit
before tax would have increased by $103 million (+19.3%) to $637
million.
Profit attributable to shareholders rose by $538 million (+106.1%) to
$1,045 million as provision for taxation increased $29 million (+21.2%)
on account of higher chargeable income.
The operating profit of the subsidiaries went up by $10 million (+6.5%)
to $170 million. This was mainly attributable to higher profits of SIAEC
Group (+$16 million) and SATS Group (+$5 million), and lower losses (+$6
million) incurred by SilkAir, partially offset by lower profit (-$16
million) from Sing-Bi Funds and a loss ($3 million) incurred by Auspice
against a profit ($1 million) achieved last year. The profit after tax
of the subsidiaries was $165 million, up $15 million (+10.3%).
The Group�s operating profit rose $206 million (+38.5%) to $739 million.
Profit before tax was $1,383 million, an increase of $653 million
(+89.3%). Share of profits of associated companies rose $101 million
(+503.5%) to $121 million mainly on account of the contribution from
Virgin Atlantic Limited (VAL) during a period that included the summer
peak season results. Profit attributable to shareholders at $1,141
million was $551 million higher (+93.3%). If the profits from the IPOs
of SATS and SIAEC in the current year and the sale of investments in DL
and SR in 1999 were excluded, profit attributable to shareholders would
have increased by $221 million (+46.1%) to $701 million.
CAPACITY, TRAFFIC AND LOAD FACTORS
Traffic carried rose 11.5%, which surpassed capacity increase of 8.5%.
Consequently, overall load factor was 2.0 percentage points better at
72.9%. Passenger load factor improved 3.0 percentage points to 77.8%,
while cargo load factor was 0.9 percentage point higher at 69.3%.
YIELD, UNIT COST AND BREAKEVEN LOAD FACTOR
Overall yield improved 2.9�/ltk (+4.4%) to 68.4�/ltk, with passenger
yield rising 3.7% and cargo yield up 4.8%. The increase in overall yield
was attributable to (i) higher local currency yields and change in the
fare mix (+3.0�/ltk), and (ii) a higher proportion of passengers than
cargo in the traffic mix (+0.3�/ltk), partially offset by a loss from
the strengthening of the Singapore Dollar against the foreign currencies
making up SIA�s revenue (-0.4�/ltk). Unit cost was 2.0�/ctk higher
(+4.6%) at 45.1�/ctk as expenditure grew (+13.2%) at a higher rate than
capacity (+8.5%).
With overall yield rising at a lower rate (+4.4%) than unit cost
(+4.6%), breakeven load factor increased 0.1 percentage point to 65.9%.
REVENUE
The Company�s revenue was $4,615 million, an increase of $666 million
(+16.9%). Passenger and cargo revenue rose $487 million (+16.8%) and
$146 million (+16.2%) respectively.
The Group�s revenue increased $662 million (+15.4%) to $4,966 million.
EXPENDITURE
The Company�s expenditure rose $472 million (+13.2%) to $4,046 million.
The main expenditure increases were in fuel costs (+$296 million or
57.8%), staff costs (+$63 million or 10.7%), provision for frequent
flyer costs (+$36 million or 81.8%), handling charges (+$32 million or
7.8%), aircraft maintenance and overhaul costs (+$22 million or 8.3%),
rentals on lease of aircraft (+$17 million or 15.6%), and landing,
parking and overflying charges (+$13 million or 5.8%). These were
partially offset by lower exchange loss (-$24 million or 48.7%).
The Group�s expenditure amounted to $4,227 million, up $456 million
(+12.1%).
ISSUED SHARE CAPITAL
Under the share buyback programme (which was first approved by
shareholders on 11 September 1999, with the mandate renewed at the
Company�s extraordinary meeting on 15 July 2000), the Company made a
further purchase of 25,629,600 of its shares between 1 April and 30
September 2000 at a total cost, including brokerage, of $407 million. As
at 30 September 2000, the issued share capital of the Company, after
taking into account the share buybacks, was 1,224,902,622 shares. The
amount spent so far under the programme at 30 September 2000 for 57.6
million shares totalled $917 million ($510 million up to 31 March 2000
plus $407 million from 1 April 2000 to 30 September 2000), including
brokerage but excluding Section 44 tax prepayments of $316 million.
SHARE OPTION PLAN
On 3 July 2000, the Company made a second grant of share options and
12,258,890 share options were accepted by eligible employees to
subscribe for ordinary shares under the SIA Employee Share Option Plan
(the Plan) for the exercise period 3 July 2001 to 2 July 2010. As at 30
September 2000, options to subscribe for 26,192,180 ordinary shares
remain outstanding under the Plan.
INVESTMENT IN AIR NEW ZEALAND
During the period under review, the Company acquired a 25% equity
interest (8.3% on 11 April 2000 and 16.7% on 8 August 2000) in Air New
Zealand class B shares at a total cost of $355 million. Goodwill arising
from the acquisition (as a result of the cost of investment exceeding
the net book values of tangible assets acquired) amounted to $96
million. At Group level, the amount of the goodwill is written off
against shareholders� distributable reserves.
INTERIM DIVIDEND
An interim dividend of 15.0 cents per $1 ordinary share, less income tax
at 25.5% (amounting to $137 million) has been declared. The interim
dividend of 15.0 cents per $1 ordinary share is 5.0 cents higher than in
the preceding year.
FINANCIAL POSITION
At 30 September 2000, the shareholders� funds of the Group amounted to
$11,463 million, a drop of $931 million (-7.5%) from a year ago after
accounting for (i) share buyback of 40.3 million shares since 1 October
1999 at a total cost of $642 million, (ii) goodwill of $1,589 million
arising from the investment in Virgin Atlantic Limited written off
against shareholders� distributable reserves, (iii) goodwill of $96
million written off against shareholders� distributable reserves
resulting from the investment in Air New Zealand, and (iv) retained
profit of $1,005 million.
The net tangible assets per share of the Group fell $0.44 (-4.5%) to
$9.36 at 30 September 2000.
The Group�s total assets stood at $17,527 million on 30 September 2000,
down $21 million (-0.1%).
The net liquid assets of the Group dropped $1,296 million (-42.2%) to
$1,775 million at 30 September 2000. This was mainly because of
investments in Virgin Atlantic Limited and Air New Zealand, aircraft
purchases, and the share buyback of the Company�s shares, partially
offset by proceeds from the IPOs of SATS and SIAEC, and sales of
aircraft.
STAFF PRODUCTIVITY
The Company's average staff strength increased by 400 (+2.9%) mainly
from cabin crew (+273) to 14,012. The Company's staff productivity,
measured by the average changes in capacity produced, load carried,
revenue earned and value added per employee, improved 14.6% (if the
profits from the IPOs in the current year and the sale of investments in
DL and SR in 1999 were excluded, the improvement would have been 8.4%).
The Group's staff strength rose 557 (+2.0%) to 27,952. Group staff
productivity, measured by revenue and value added per employee, improved
13.1% and 31.5% respectively (if the profits from the IPOs in the
current year and the sale of investments in DL and SR in 1999 were
excluded, value added per employee would have improved by 18.0%).
FLEET AND ROUTE DEVELOPMENT
On 29 September 2000, Singapore Airlines (SIA) announced an US$8.6
billion order for 25 super-jumbo A3XX very large aircraft (VLA). The
price tag includes the cost of spares and installed engines (but not
spare engines).
The prices are applicable at the time of aircraft delivery, between
early 2006 and 2011, with price escalation factors incorporated.
Ten of the aircraft are firm orders, the rest options. The 15 options
can be exercised for freighters as well as passenger aircraft.
The VLA with over 500 seats will be the largest passenger aircraft ever
produced. With the first delivery scheduled for early 2006, SIA will be
the first airline in the world to accept and operate this revolutionary
aircraft. (SIA was also the first airline, together with a US airline,
to operate the Boeing 747-400).
The A3XX has a range of 7,500 nautical miles, in SIA�s configuration.
SIA intends to deploy it on its high-density routes to London, Los
Angeles, San Francisco, New York, Tokyo, Hong Kong and Sydney.
The A3XX routes to the USA will entail an intermediate point. They will
complement the non-stop services that SIA plans to operate to US points
in 2002 with the super-long-range Airbus A340-500.
On 13 October 2000, SIA announced the selection of the Rolls Royce Trent
900 series engines to power its 25 super-jumbo A3XX very large aircraft.
The US$8.6 billion A3XX order (announced on 29 September 2000) had
included the cost of installed engines and spares, but not spare
engines. The cost of the Trent 900 series spare engines will add another
US$245 million to the A3XX aircraft order.
With a fan diameter of 116 inches, the Trent 900 will be initially rated
at 70,000 pounds of thrust. It will incorporate a three-shaft design and
will be a scaled version of the proven Trent 800, which powers SIA�s
Boeing 777 fleet. The engine will also be designed to meet the stringent
QC2 noise certification on the A3XX.
In April-September 2000, one B747-400 passenger aircraft was sold and
leased back and one surplus A310-200 passenger aircraft was traded-in to
Boeing. No new passenger aircraft was delivered during this period.
As at 30 September 2000, SIA's operating fleet comprises 84 passenger
aircraft --- 36 B747-400s, 18 B777s (8 B777-200s, 5 B777-200As and 5
B777-300s), 15 A340-300s and 15 A310-300s.
From 26 March 2000, frequency to Athens was increased by one, to 4 times
weekly. Frankfurt service was increased from 10 times a week to 11 times
on 1 July 2000.
Capacity on Singapore-Bangkok-Seoul routes was boosted from 3 to 5 times
A340-300 weekly services at the commencement of Northern Summer 2000.
From 1 July 2000, the Singapore-Taipei-Osaka flights were reduced to 3x
weekly B777-200 from 4x weekly B747-400. Concurrently, 3 more B777-200
weekly non-stop flights were introduced to Osaka. Additional 4 times
weekly services were also introduced to Hong Kong.
Frequency to Surabaya was increased to 12 times A310-300 weekly services
from 26 March. Jakarta services were restored from 7 times to 8 times
daily. 3x additional A313 Singapore-Bali night-stop services were
introduced from 1 July 2000 allowing Bali to be served more frequently,
in view of the continuing favourable Bali appeal particularly among
Japanese and European tourists.
From Northern Summer 2000, services to Lahore and Karachi were increased
from 3 times to 4 times weekly. New Delhi also enjoys an additional
service, effecting a daily B777-200 product. Capacity was also increased
on the Bombay and Madras routes through the use of bigger aircraft.
Commencing April 2000, a third daily service to Sydney was introduced to
meet the strong demand from the Olympics Games traffic. Capacity to
Melbourne was also increased to the operation of twice daily B747-400
services.
Another 747-400 freighter joined the fleet in September 2000 - bringing
the fleet to nine Mega Arks. A new freighter service will be inaugurated
to Osaka, Japan. A new routing to the USA via Hong Kong will add
frequencies to San Francisco and Los Angeles. Another frequency will be
added to Copenhagen.
SUBSEQUENT EVENTS
The Company has concluded an agreement to sell two B747-300 Combis.
On 29 September 2000, the Company announced an US$8.6 billion order for
25 (10 firm and 15 options) super-jumbo A3XX very large aircraft. The
price includes the cost of spares and installed engines but not spare
engines. Following the order, the Company has selected Rolls Royce Trent
900 series engines to power its 25 super-jumbo A3XX. In addition, the
Company also ordered Rolls Royce Trent 900 series spare engines at a
cost of US$245 million.
The Company has decided to purchase from Boeing six firm B747-400
freighter aircraft with options for nine more at a total cost of US$3.4
billion. The purchase entails a trade-in of two B747-300 passenger
aircraft to Boeing.
Air New Zealand announced that the company will raise up to NZ$284
million by way of a renounceable pro rata offer of New Ordinary Shares
to existing shareholders on the basis of one New Ordinary Share for
every three A Ordinary or three B Ordinary shares held, at the issue
price of NZ$1.50 per share. The Company intends to take up its
entitlement of 47,291,636 New B Ordinary Shares under the issue at a
total cost of NZ$71 million due for payment on 3 November 2000.
OUTLOOK FOR SECOND HALF OF THE FINANCIAL YEAR
The outlook for passenger and cargo in the second half of the year is
good. Passenger traffic is expected to continue to be strong and load
factors high. Stations will be encouraged to uphold yields. For cargo,
intra-Asia airfreight movements and Asian exports to Europe and United
States of America are projected to be moderately strong over the next
six months.
However, escalating fuel costs will remain a major concern. As at 30
September 2000, about 50% of SIA�s fuel requirements for the second half
has been hedged.
Annex A
UNAUDITED FINANCIAL RESULTS FOR THE SIX MONTHS ENDED 30 SEPTEMBER 2000
FINANCIAL STATISTICS
| |
Apr-Sep 00 |
Apr-Sep 99 |
% |
Change |
FY
1999-00 |
| GROUP ($ million)
|
|
|
|
|
|
| Total revenue |
4,965.5 |
4,303.5 |
+ |
15.4 |
8,899.4 |
| Total expenditure |
4,226.5 |
3,770.1 |
+ |
12.1 |
7,759.4 |
| Operating profit |
739.0 |
533.4 |
+ |
38.5 |
1,140.0 |
| Profit before tax |
1,383.3 |
730.7 |
+ |
89.3 |
1,463.9 |
| Profit attributable
to shareholders |
1,141.4 |
590.5 |
+ |
93.3 |
1,163.8 |
| |
As at |
As at |
|
|
| |
30 Sep
00 |
30 Sep
99 |
% |
Change |
| Share capital |
1,224.9 |
1,265.2 |
- |
3.2 |
| Distributable
reserves |
7,926.3 |
8,858.4 |
-
|
10.5 |
| Non-distributable
reserves:- |
|
|
|
|
| Capital redemption |
57.6 |
17.3 |
+ |
232.9 |
| Share premium |
447.2 |
447.2 |
|
- |
| Capital reserve |
6.9 |
6.3 |
+ |
9.5 |
| Special
non-distributable reserve |
1,800.0 |
1,800.0 |
|
- |
| Shareholders� funds |
11,462.9 |
12,394.4 |
- |
7.5 |
| Total assets |
17,526.6 |
17,547.2 |
- |
0.1 |
| Net liquid assets |
1,774.7 |
3,070.7 |
- |
42.2 |
| |
Apr-Sep 00 |
Apr-Sep 99 |
% |
Change |
FY
1999-00 |
| PER SHARE DATA |
|
|
|
|
|
| Earnings before tax
(cents) |
112.8 |
57.0 |
+ |
97.9 |
115.0 |
| Earnings after tax
(cents) - basic* |
93.1 |
46.1 |
+ |
102.0 |
91.4 |
|
- diluted |
93.0# |
46.1 |
+ |
101.7 |
91.4# |
| Net tangible assets
($) |
9.36 |
9.80 |
-
|
4.5 |
8.76 |
| Gross dividend
(cents) |
15.0 |
10.0@ |
+ |
50.0 |
30.0@ |
| COMPANY ($ million)
|
|
|
|
|
|
| Total revenue |
4,614.6 |
3,948.3 |
+ |
16.9 |
8,202.2 |
| Total expenditure |
4,045.7 |
3,574.0 |
+ |
13.2 |
7,384.8 |
| Operating profit |
568.9 |
374.3 |
+ |
52.0 |
817.4 |
| Profit before tax |
1,211.6 |
644.6 |
+ |
88.0 |
1,641.5 |
| Profit attributable
to shareholders |
1,044.8 |
507.0 |
+ |
106.1 |
1,267.1 |
* Based on the
weighted average number of fully paid shares in issue.
# Based on the weighted average number of fully paid shares in issue
after adjusting for dilution of shares under the employee share option
plan.
@ Including 4.75 cents per $1 ordinary share tax-exempt dividend.
Annex A
OPERATING STATISTICS - COMPANY
| |
Apr-Sep
00 |
Apr-Sep
99 |
% |
Change |
FY
1999-00 |
| Load tonne-km
(million) |
6,524.6 |
5,852.7 |
+ |
11.5 |
12,038.4 |
| Capacity tonne-km
(million) |
8,950.0 |
8,251.9 |
+ |
8.5 |
16,917.2 |
| Overall load factor
(%) |
72.9 |
70.9 |
+ |
2.0
pts |
71.2 |
| Passenger carried
(thousand) |
7,584 |
6,752 |
+ |
12.3 |
13,782 |
| Revenue passenger-km
(million) |
36,136.6 |
32,288.3 |
+ |
11.9 |
65,718.4 |
| Available seat-km
(million) |
46,477.5 |
43,145.7 |
+ |
7.7 |
87,728.3 |
| Passenger load factor
(%) |
77.8 |
74.8 |
+ |
3.0
pts |
74.9 |
| Cargo carried
(million kg) |
488.5 |
432.5 |
+ |
12.5 |
905.1 |
| Cargo load tonne-km
(million) |
3,019.1 |
2,727.7 |
+ |
10.7 |
5,668.2 |
| Cargo capacity
tonne-km (million) |
4,356.5 |
3,986.2 |
+ |
9.3 |
8,244.4 |
| Cargo load factor (%) |
69.3 |
68.4 |
+ |
0.9
pt |
68.8 |
| Yield (�/ltk) -
overall |
68.4 |
65.5 |
+ |
4.4 |
66.0 |
| - passenger |
97.8 |
94.3 |
+ |
3.7 |
95.3 |
| - cargo |
34.8 |
33.2 |
+ |
4.8 |
33.7 |
| Unit cost (�/ctk) |
45.1 |
43.1 |
+ |
4.6 |
43.7 |
| Breakeven load factor
(%) |
65.9 |
65.8 |
+ |
0.1
pt |
66.2 |
Glossary
Load tonne-km (ltk)=Load carried (in tonnes) x distance flown (in km)
Capacity tonne-km (ctk) = Capacity production (in tonnes) x distance
flown (in km)
Overall load factor = Load tonne-km expressed as a percentage of
capacity tonne-km
Revenue passenger-km = Number of passengers carried x distance flown (in
km)
Available seat-km = Number of available seats x distance flown (in km)
Passenger load factor = Revenue passenger-km expressed as a percentage
of
available seat-km
Cargo load tonne-km = Cargo load carried (in tonnes) x distance flown
(in km)
Cargo capacity tonne-km = Cargo capacity production (in tonnes) x
distance flown
(in km)
Cargo load factor = Cargo load tonne-km expressed as a percentage of
cargo capacity tonne-km
Yield = Operating revenue from scheduled services divided by load
tonne-km
Unit cost = Operating expenditure divided by capacity tonne-km
Breakeven load factor = Theoretical load factor at which operating
expenditure equals operating revenue, i.e. unit cost divided by yield |

 Korean Air to Launch Direct Flights Between Seoul Incheon and Portugal
 Marriott's 150th Hotel in India is a Vegetarian Resort in Katra
 Plaza Premium Expands Flight Club at Kuala Lumpur Airport with Restaurant in T1
 Aviation: International RPK Increases 18.9% Globally; Asia Pacific Airlines +38.5%
 Brunei Orders Six H145M Helicopters to Replace BO105s
 Singapore-Based Lessor Orders 10 ATR 72-600s
 AirAsia's Seventh Airline Launches Flights
 Pattaya Airways Takes Delivery of First of Two ATR Freighters
 Minor Hotels Opens Office in Bengaluru; Targets 50 Hotel Openings in India Within Decade
 Marriott Opens Eighth Sheraton Hotel in Vietnam
 IHG Signs Hotel in The Forestias Mixed-Use Development Near Bangkok, Thailand
 Association of Asia Pacific Airlines Reports March 2024 Traffic Numbers
 Hong Kong Airlines Resumes Saipan Flights
 Sabre Becomes First GDS to Provide NDC Content Through Zeno
 FCM Appoints Siddharth Mehta as Vice President of Supply for India
 Hong Kong Airlines Launches Flights to Vientiane, Laos
 Air Astana to Resume Flights Between Astana and Seoul, South Korea
 Airbus Expands Pléiades Neo Earth Observation Constellation
 ASM Global to Operate ICC Sydney for 10 More Years
 SAS Signs Alliance Adherence Agreement with SkyTeam
 OUE Awarded Tender for 255-Room Zero-Energy Hotel at Changi Airport, Singapore
 Korean Air to Launch Seoul Incheon - Macau Flights
 John Girard Joins Plaza Premium as General Manager Operations - Hong Kong
 IndiGo to Order 30 A350-900s Powered by 60 Rolls-Royce Trent XWB-84s
 Sabre Expands Lodging, Ground & Sea Team
 Lodz Airport (LCJ) Central Poland - Interview with Robert Makowski, Commercial Director (CCO)
 Greenland Airports - Interview with Jens R. Lauridsen, CEO
 Glasgow (GLA), Southampton (SOU) and Aberdeen Airports (ABZ) - Interview with Christopher Tibbett, Aviation Director
 Visit Aarhus - Interview with Pia Lange Christensen, CEO
 Aarhus Airport (AAR) in Denmark - Interview with Lotta Sandsgaard, CEO
 Visit Estonia - Interview with Kristina Kästik, B2B Team Lead, at Routes Europe 2024
 Airsiders - Interview with Antonio Pascale, Commercial Director, at Routes Europe 2024
 PDC Airport Solutions - Interview with Flemming Glyager at Routes Europe 2024 in Aarhus, Denmark
 Hannover Airport (HAJ) - Interview with Prof. Dr. Martin Roll, CEO
 Princess Juliana Airport (SXM) - Interview with Michiel Parent, Commercial Director
 London Southend Airport (SEN) - Interview with Marc Watkins, RDM
 Tallinn Airport (TLL) in Estonia - Interview with Eero Pärgmäe Board Member and CCO
 Isle of Man Airport (IOM) - Interview with Gary Cobb, Airport Director
 Visit Isle of Man - Interview with Deborah Heather, CEO, at Routes Europe 2024
 OAG - Interview with Chelsea Waller at Routes Europe 2024 in Aarhus, Denmark
 Aarhus Sea Rangers in Denmark - HD Video Interview with Niels K. Nielsen, Head of Guides
 IHG Signs Crowne Plaza Hotel in Dehradun, India
 Air Astana and Neos Sign MOU on Strategic Partnership
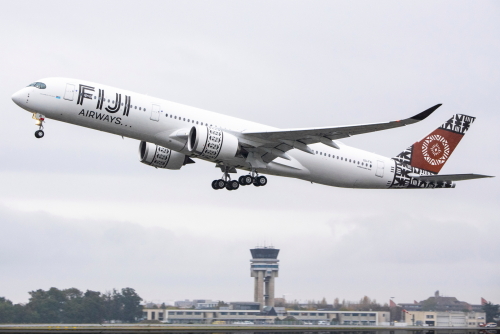 Fiji Airways to Use Assaia's TurnaroundControl Solution
 AirX Signs LOI with Eve For Up To 50 eVTOL Aircraft
 Executive Changes as bp Simplifies Organisational Structure
 Thai AirAsia to Launch Daily Flights Between Suvarnabhumi and Hat Yai
 Lufthansa's Brand New Long-Haul Allegris Cabin to Enter Service on 1 May
 Bangkok Airways Extends Partnership with Sabre
 IHG Expanding Garner Hotels Midscale Conversion Brand to More Countries
 CWT Expands Access to Finnair NDC Content in Finland and the Nordics
 Tourism Malaysia Extends Data and Market Intelligence Agreement with Travelport
 Rajiv Bhatia Joins Sabre as Executive Director - Asia Pacific Market Expansion
 Copenhagen Home to First Fairfield by Marriott Hotel in Europe
 Hawaiian Airlines' New Flagship Aircraft Enters Service
 Travelodge Opens Fourth Hotel in Seoul, South Korea
 Sabre Partners South Korean OTA, InterparkTriple
 British Airways Upgrading Weather Data Available to Pilots and Flight Planning Teams
 Air Astana Increases Flights and Resumes Services to Select Destinations
 Jean-Marie Le Gall Appointed General Manager of The Woodward Hotel in Geneva, Switzerland
 IHG Signs Second Kimpton Hotel in Portugal
 Scoot Takes Delivery of First of Nine E190-E2 Aircraft from Azorra
 Finnair Updates Summer 2025 Flight Schedule
 Delta Air Lines Launches Thrice Weekly Munich - New York JFK Flights
 Japan Coast Guard to Expand Fleet with Three Airbus H225 Helicopters
 EL AL to Implement NetLine/Ops ++
 Sabre to Upgrade Japanese Hotel Company's Distribution and Retailing Strategy
 Air Astana Upgrades Safety Training with CEET and RFFT Simulators in Astana, Kazakhstan
 Dean Dimitriou Returns to The Murray Hong Kong as Hotel General Manager
 ASM Global Appoints Matthew Lazarus-Hall as EVP Entertainment & Content
 Thai Lion Air Launches Bangkok - Kochi Flights; Appoints Çelebi as Ground Handler
 Onyx Hospitality Signs Shama Serviced Apartments in Rayong, Thailand
 AirAsia X to Resume Flights Between Kuala Lumpur and Changsha, China
 IndiGo to Launch Kozhikode - Kochi - Agatti Flights
 Neste Supplying Emirates with SAF at Amsterdam Schiphol Airport; Changi Next
 Amadeus Completes Acquisition of Vision-Box
 AirJapan Enhances Operations with Radixx PSS
 New Zealand Men and Women Win Final Sevens Tournament at Hong Kong Stadium
 Korean Air to Operate Seasonal Charter Flights Between Seoul Incheon and Taichung, Taiwan
 Pegasus Airlines Launches Flights Between Ankara and Lisbon, Portugal
 Smiths Detection Appoints Jerome de Chassey as President
 AirAsia X Resumes Flights Between Kuala Lumpur and Xi'an, China
 Cathay Cargo Resumes Freighter Flights from Saigon, Vietnam
 SITA Publishes White Paper on Role of Biometrics in Air Travel
 Cheval Collection Expands Global Hotel Alliance's Portfolio to Serviced Apartments
 Langham Rebrands Hotel in Foshan, China
 Aviation: International Passenger Demand Up 26.3%; Asia Pacific Airlines Report 53.2% Increase
 International Air Cargo Demand Up 12.4% in February 2024; Capacity Up 16%
 L'Occitane Group Appoints Green Yip as Regional MD - Travel Retail Asia Pacific
 Le Bristol Paris Appoints Arnaud Faye as Executive Chef
 Chris Kemlo Appointed General Manager of The Calile Hotel in Brisbane, Australia
 Sabre Space Roadshow to Take Place in Delhi and Mumbai, India
 Malaysia Airlines and IndiGo to Codeshare
 Accor Expands Portfolio with 22 Hotels in Japan
 FlyArystan Receives AOC from Aviation Administration of Kazakhstan
 Marriott Opens Resort on Perhentian Keci Island in Terengganu, Malaysia
 AirAsia Malaysia Resumes Kuching - Penang and Kota Kinabalu - Penang Flights
 Hong Kong Stadium Prepares for Final Sevens; International Fans Buy Over 40% of Tickets
 ExecuJet Opens New MRO Facility at Subang Airport Near Kuala Lumpur, Malaysia
 Michelle Freyre to Join United Airlines' Board of Directors
 Lloyd's Inn Kuala Lumpur to Open 1 April
 Korean Air Unveils New Maintenance, Aerospace, Cargo and Ground Handling Uniforms
 SalamAir to Launch Flights Between Muscat and Tirana, Albania
 IHG Unveils New Staybridge, Candlewood and Atwell Suites Prototypes in USA
 DHL Aviation Extends Partnership with Worldwide Flight Services in France
 United Airlines Installing Larger Overhead Bins on Embraer E175 Fleet
 Not Everyone Wants to Use an App; Bonza Enhances Booking Options with Website
 Amadeus Expands Travel4Impact Globally; Applications Open Until 30 April
 Asia Pacific Airlines Carried 27 Million Int. Passengers in February; Cargo Demand Up 10.2%
 Aris Maroulis Joins TUMI as Vice President Asia-Pacific and the Middle East
 AirAsia Malaysia to Resume Flights Between Kuala Lumpur and Vientiane, Laos
 First Courtyard by Marriott Hotel in Western Australia Opens in Murdoch, Perth
 Qantas Appoints Nick McGlynn as Executive Vice President - Asia
 HotelREZ Renews Partnership with Sabre Hospitality
 Marlon Abeyakoon Appointed GM of NH Collection Maldives Havodda Hotel
 Amex GBT Signs Deal to Buy CWT
 Korean Air Connects Cargo Booking System with DHL Global Forwarding
 Sean Seah Returns to Langham as Senior Vice President - Strategy, Technology and Innovation
 Radisson Targets 25 Hotels in Morocco by 2030; Expands Role of Erwan Garnier
 Airbus to Enhance Cybersecurity Capabilities with Infodas Acquisition
 Mandarin Oriental Exclusive Homes Adds 16-Bedroom Chateau in France to Portfolio
 Korean Air to Order 33 Airbus A350 Aircraft
 AAPA to Host Turboprop Safety Conference in Kuala Lumpur, Malaysia
 Nassau, Bahamas to Host Routes Americas 2025 in February
 FlyAngola Appoints APG as Offline GSA in Portugal
 AirAsia Cambodia Prepares for Take Off
 Alex Schellenberger Joins Mandarin Oriental as Senior Vice President Brand
 Ethiopian Airlines Opens E-Commerce Logistics Facility at Bole Addis Ababa Airport
 Routes Americas 2024 Taking Place in Bogota, Colombia
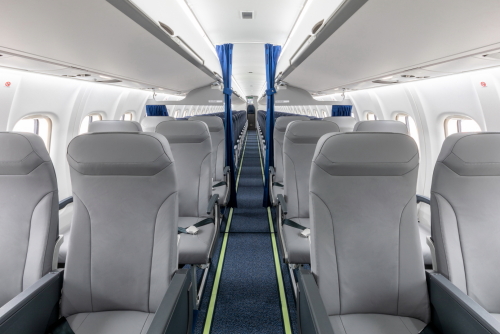 Air Botswana Appoints APG as GSA in 16 Markets
 WestJet Appoints APG as Representative in South Korea; Airline to Launch YYC-ICN Flights in May
 Courtyard by Marriott Hotel Opens in Fukui, Japan
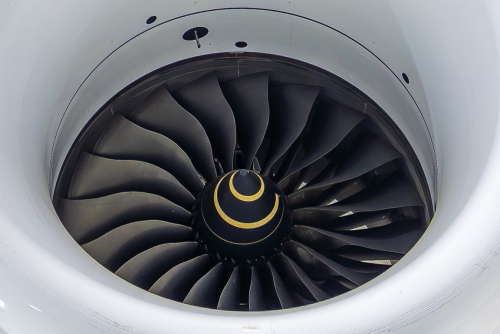 Rolls-Royce to Expand Engine Build and Services Capacity in UK and Germany
 United Airlines to Launch Los Angeles - Shanghai Flights; Increase LAX - HKG Service
 Nine Exclusive HD Video Interviews from Routes Asia 2024 in Langkawi, Malaysia
 AirAsia X Launches Direct Flights Between Kuala Lumpur and Almaty, Kazakhstan
 Singapore Airlines Revamps Premium Economy Class with New Menu and Amenity Kit
 Amadeus Completes Acquisition of Voxel
 Minor to Rebrand NH Museum Quarter Hotel in Amsterdam, Netherlands
 U-Tapao Airport (UTP) in Rayong / Pattaya, Thailand - HD Video Interview with Ampika Chadawong
 Perth Airport (PER) in Western Australia - HD Video Interview with Stephanie Juszkiewicz
 China Airlines to Launch Flights Between Taipei and Seattle, USA
 TUMI Launches Capsule Collection in Partnership with NEOM McLaren Extreme E Team
 AirAsia Malaysia to Resume Flights Between Kuala Lumpur and Pattaya, Thailand
 Thai Airways to Launch Flights from Bangkok to Colombo, Kochi and Perth
 Munich Airport (MUC) in Bavaria, Germany - HD Video Interview with Michael Haeffner
 Japan Tourism, World Expo 2025 and Japan Expo 2025 - HD Video Interview with Akira Watabe of JNTO
 BBN Airlines Indonesia Receives Additional AOC from DGCA
 Vietnam Airlines to Launch Flights from HAN and SGN to Munich Airport in Bavaria, Germany
 Sabre Launches Booking Solution for New and Independent Travel Consultants
 AirAsia Malaysia Launches A321neo Flights Between Kuala Lumpur and Perth, Australia
 Saudi Arabia's Air Connectivity Program - HD Video Interview with Rashed Alshammari, Vice President Commercial
 Lui Chong Chee to Succeed Bob Tan as Chairman of the Boards of CapitaLand Ascott Trust
 Sabah Tourism Board - HD Video Interview with Julinus Jeffery Jimit, Chief Executive Officer
 Berlin Airport (BER) - HD Video Interview with Simon Miller, Senior Manager Market Intelligence
 IndiGo to Launch Flights Between Chandigarh and Dharamshala, India
 Skyco Partners Airbus; Orders Six H175 Helicopters
 Jumeirah Appoints Michael Grieve as Chief Brand Officer
 Cam Ranh Airport (CXR) in Nha Trang, Vietnam - HD Video Interview with Le Thi Hong Minh
 Mercure Langkawi Pantai Cenang - HD Video Interview with Hotel GM, Jasmine Keh
 Courtyard by Marriott Phnom Penh Appoints Lenen Mar Porras as ADOSM
 United Confirms Flights to Cebu, Philippines as Airline Expands Network
 Jumeirah Soft Opens First Hotel in Saudi Arabia
 IHG Signs Two Luxury Hotels in KAFD Riyadh, Saudi Arabia
 Qatar Airways' NDC Content Now Available on Travelport+
 Estelle Vassallo Moves to Italy as GM of Anantara Convento di Amalfi Grand Hotel
 Amora Completes Refurbishment and Rebranding of Hotel in Brisbane, Australia
 Scoot Unveils Embraer E190-E2 Routes
 Jazeera Airways Appoints Barathan Pasupathi as CEO
 Marriott Signs Le Meridien Hotel in Zanzibar
 IATA Reports Air Cargo Data for January 2024
 BFS Receives GDP Certification for Dedicated Pharma Handling Facility at Suvarnabhumi Airport (BKK)
 Solomon Islands Welcomed 26,036 Visitors in 2023; Positive Outlook for 2024
 Vietjet Signs MOU with Airbus for 20 A330-900 Aircraft
 Hong Kong Airport Reports January 2024 Passenger and Cargo Numbers
 Malaysia Aviation Group Becomes Official Airline Partner of MATTA Fair 2024
 AirAsia Malaysia Launches Flights Between Kota Kinabalu and Shanghai, China
 Taiwan's Starlux Airlines Orders Five Airbus A350 Freighters and Three A330neos
 Hahnair Appoints Stephen Chung as Regional Vice President Asia Pacific
 Thai Airways Confirms Boeing 787-9 Order
 SkyScape Becomes Eve Air Mobility's First Urban ATM Customer in Japan
 Royal Brunei Airlines Orders Four Boeing 787-9 Aircraft
 Moxy Hotel Opens in Bangkok, Thailand
 Peninsula Bangkok Appoints Masahisa Oba as Managing Director
 Silk Avia Takes Delivery of First New ATR 72-600 Turboprop Aircraft in Central Asia
 Rohit Pandey Returns to Minor as GM of the Anantara Jaipur Hotel
 Marriott Soft Opens First Moxy Hotel in Malaysia
 AirAsia X to Launch Flights Between Kuala Lumpur and Almaty, Kazakhstan on 14 March
 Malaysia Airlines Opens Ticketing Outlet at Paradigm Mall in Petaling Jaya
 Marriott Expands Apartments with Properties Signed in Italy, USA and Saudi Arabia
 Stockholders of Hawaiian Holdings Vote to Adopt Merger Agreement with Alaska Airlines
 Thailand Travel Mart Plus (TTM+) 2024 Opens Online Registration for Buyers and Sellers
 Lore Group's Five Design-Led Hotels Join Global Hotel Alliance
 Hilton Partners Small Luxury Hotels of the World
 British Airways Using E-Logs Platform to Predict and Enhance Aircraft Maintenance Issues
 Surf Air Mobility Secures Early Delivery Positions for 90 Electra eSTOL Aircraft
 Nine Exclusive Video Interviews with VIPs at ASEAN Tourism Forum 2024 in Vientiane, Laos
 Thai Airways to Unveil Details of Boeing Aircraft Order at Singapore Air Show 2024
 Hong Kong Reports Provisional Visitor Arrival Numbers for January 2024
 Accor Hotels in New Zealand to Become Gold Standard Sustainable Tourism Businesses
 American Express Opens World's Largest Centurion Lounge at ATL Airport in USA
 Minor Hotels Reports Record Full Year Figures
 Korean Air's Acquisition of Asiana Gets Conditional Clearance from European Commission
 CapitaLand Establishes CLARA Fund II; Acquires Two lyf-Branded Properties as Seed Assets
 ATR Receives B-Score from CDP Climate Change
 Dassault to Showcase Falcon 6X and Falcon 2000LXS at the Singapore Air Show 2024
 Settha Palace Hotel in Vientiane, Laos - Interview with Hala Krimi, General Manager
 Vietjet Launches Flights Between Saigon and Chengdu, China
 Inthira Vang Vieng Hotel in Laos - Interview with Charles-David Hay, General Manager
 IHG Hotels at Dubai Festival City Appoints Pranav Vohra as Cluster Commercial Director
 S Vang Vieng Boutique Hotel in Laos - Interview with Sengnikone Bouphaphanh
 Full Moon Island Resort in Kaoh Sdach, Cambodia - Interview with Indra Khanitha Lay Prohas
 Jetstar Launches Flights from Brisbane to Osaka and Seoul
 IHG to Expand Six Senses Brand to Kyoto, Japan
 DiscoverLaos - HD Video Interview with Southisack Sayasavanh, Tours Director
 Cosi Vientiane Nam Phu Hotel - Interview with Pasin Nopsuwan, General Manager
 Hyatt Expands JdV Brand of Hotels to Goa, India
 Thailand to See Increase in Chinese New Year Tourism Spend
 Lao Airlines - Exclusive Video Interview with Chanthanon Khampheng at ATF 2024
 Dansavanh Nam Ngum Resort in Laos - Interview with Michelle Wang, Travel Director
 Marriott Hotel Opens on Gurney Drive in Penang, Malaysia
 Emirates to Increase Capacity on Flights to Osaka, Japan
 Michelle Lee Joins Pullman Bangkok Hotel G as General Manager
 Rosewood Makes Changes to Senior Management Team
 Smiths Detection to Upgrade Security at Fukuoka Airport in Japan
 Standard to Open Residences in Hua Hin and Phuket, Thailand; Video Interview with Amar Lalvani
 AirAsia Indonesia Launches Flights Between Jakarta and Kota Kinabalu, Malaysia
 Philippine Airlines to Deploy Amadeus Traveler DNA
 Mantra Club Croc Airlie Beach Completes A$8 Million Refurbishment of All 160 Guestrooms
 Singapore Cruise Centre to Upgrade Tanah Merah Ferry Terminal
 IHG Signs New-Build 150-Key Holiday Inn Hotel in Guwahati, India
 Thai AirAsia Launches Flights from Bangkok (DMK) to Shanghai and Kaohsiung
 TFE Signs New-Build Apartment Hotel in Brisbane, Australia
 Ritz-Carlton Hotel Opens in Las Colinas Area of Dallas, USA
 8 NTO Press Conferences from the ASEAN Tourism Forum 2024 in Vientiane, Laos
 Swiss to Launch Flights Between Zurich and Seoul, South Korea
 Singapore Welcomed 13.6 Million Visitor Arrivals in 2023; Targets 15-16 Million in 2024
 Cathay Pacific Resumes Flights Between Hong Kong and Chennai, India
 Greater Bay Airlines Increases Flights Between Hong Kong and Bangkok, Thailand
 Laos Tourism Press Conference at the ASEAN Tourism Forum 2024 in Vientiane, Lao PDR
 Thailand Tourism Press Conference with Thapanee Kiatphaibool and Nithee Seeprae of TAT
 Philippines Tourism Press Conference at the ASEAN Tourism Forum 2024 in Vientiane, Laos
 Malaysia Tourism Press Conference at the ASEAN Tourism Forum 2024 in Vientiane, Laos
 Cambodia Tourism Press Conference at the ASEAN Tourism Forum 2024 in Vientiane, Laos
 Singapore Tourism Press Conference by Kwan Su Min, Director Communications Marketing Group, STB
 Myanmar Tourism Press Conference by Tin Myo Aung, Deputy Director - Ministry of Hotels and Tourism at ATF 2024
 Vietnam Tourism Press Conference at ASEAN Tourism Forum (ATF) 2024 in Vientiane, Laos
 Thai AirAsia Launches Flights Between Hat Yai and Singapore
 CapitaLand Sells Citadines Mount Sophia Singapore for SG$148 Million
 American Airlines to Launch Flights Between DFW and Brisbane, Australia
 Minor Hotels Signs Second Anantara Resort in Oman
 Dubai Home to Dorchester Collection's First Hotel in Middle East
 Amadeus Adds Border Control Solutions to Portfolio with Vision-Box Acquisition
 Ascott Opens 8th Citadines Property in Singapore
 Brix Hotel by Pinetree Opens in Sepang, Malaysia
 Capella to Open Hotel in Taipei, Taiwan
 Seibu Prince Hotels to Deploy Sabre SynXis Central Reservation System
 Hong Kong Airport Reports December and Full-Year 2023 Traffic
 IHG Signs Franchise Agreement for a voco Hotel in Stockholm, Sweden
 Air Canada Joins Hidden Disabilities Sunflower Program
 IHG Signs Sixth Vignette Collection Hotel in Thailand
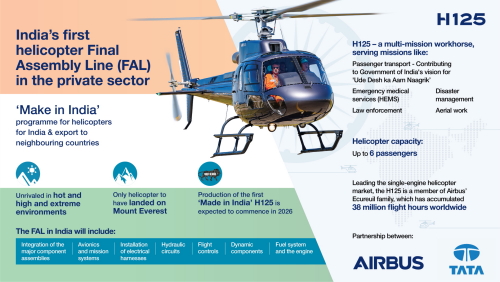 Airbus Helicopters Partners Tata to Establish H125 Final Assembly Line in India
 Strikes Force Finnair to Cancel Around 550 Flights
 Record Number of Summer Flights from Munich Airport to Asia
 AirAsia Move Expands Event Ticketing with Coras Partnership
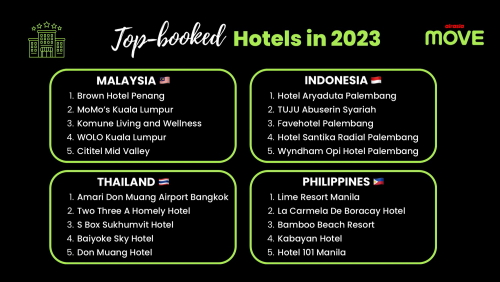 AirAsia Unveils Top Hotels and Destinations Booked in 2023
 Air China Resumes Shanghai - Munich Flights
 Finnair Warns of Possible Flight Cancellations
 India's Akasa Air Orders 150 More Boeing 737 MAX Aircraft
 Marriott Puts Together Consumer Operations Team in Asia Pacific
 Etihad Airways Expands Distribution Agreement with Travelport
 AirAsia to Relocate Operations at Guangzhou Baiyun International Airport
 Tumi Partners Weber Zhang for 2024 Lunar New Year Collection
 Crowne Plaza Changi Airport Hotel Completes Enhancement Project
 Mandarin Oriental Opens First Hotel in Saudi Arabia
 IHG Appoints Leanne Harwood as SVP / MD, Luxury & Lifestyle - Americas
 Cebu Pacific Adds Two Electric Buses to Airport Shuttle Fleet at NAIA in Manila
 St. Regis Resort Opens on Private Island in Red Sea, Saudi Arabia
 Marriott Hotel Opens in Nagasaki, Japan
 Qantas to Launch E190 Flights Between Darwin and Singapore
 Hahn Air Becomes Hahnair as Company Unveils New Brand Identity
 Scandinavian Airlines Adds Atlanta Flights to Summer 2024 Schedule
 Cross Expands Vibe Brand to Indonesia with Opening of Hotel in Kuta, Bali
 Marriott to Expand Ritz-Carlton Yacht Collection with Ilma in 2024 and Luminara in 2025
 Minor Opens First Avani Hotel in Germany
 IHG Signs New-Build Hotel in Abha, Saudi Arabia
 Exclusive HD Video Interviews with VIPs at World Travel Market 2023 in London, England
 Seville to Host Routes Europe 2025 Forum
 HD Video Interviews from APG World Connect 2023 in Monaco, France
 Exclusive Videos from Routes World 2023 in Istanbul, Türkiye
 Central Poland - Interview with Robert Makowski, Commercial Director (CCO)")

, Southampton (SOU) and Aberdeen Airports (ABZ) - Interview with Christopher Tibbett, Aviation Director")

 in Denmark - Interview with Lotta Sandsgaard, CEO, at Routes Europe 2024")


 - Interview with Prof. Dr. Martin Roll, CEO, at Routes Europe 2024")
 - Interview with Michiel Parent, Commercial Director")
 - Interview with Marc Watkins, RDM")
 in Estonia - Interview with Eero Pärgmäe Board Member and CCO")
 - Interview with Gary Cobb, Airport Director")


 in Western Australia - Interview with Stephanie Juszkiewicz, SVP Aviation Business Development, at Routes Asia 2024 in Langkawi, Malaysia")
 Rayong / Pattaya, Thailand - Interview with Ampika Chadawong, at Routes Asia 2024 in Langkawi, Malaysia")
 in Nha Trang, Vietnam - Interview with Le Thi Hong Minh at Routes Asia 2024 in Langkawi, Malaysia")


 - Interview with Simon Miller, Senior Manager Market Intelligence, at Routes Asia 2024 in Langkawi, Malaysia")


 at ATF 2024")


 2024 in Vientiane, Laos")


 to Rebrand as DTH Travel - HD Video Interview with Stephan Roemer, Partner and Group CEO")

 - HD Video Interview with Rohan A. Khaunte, Minister for Tourism at WTMLDN 2023")

 Tourism - Interview with Prateek Hira, President & CEO of Tornos, at WTMLDN 2023")

 - Interview with Sheo Shekhar Shukla, Principal Secretary Culture & Tourism, at WTMLDN 2023")
 - Interview with Dr. Rashmi Sharma, Director - Department of Tourism, at WTMLDN 2023")
 2023")


.")


 of Malaysia Tourism Promotion Board (MTPB), at Routes World 2023 in Istanbul, Türkiye.")
 at Routes World 2023 in Istanbul, Türkiye.")

 - Interview with Ulla Lettijeff, SVP and Director (Finavia), at Routes World 2023")
 New Satellite Terminal - Airports of Thailand Interview with Paweena Jariyathitipong, Senior Executive Vice President (Engineering and Construction), by Steven Howard of TravelNewsAsia.com on 15 October 2023 at Routes World 2023 in Istanbul, Turkiye.")

 - Interview with Qiang Wang, Deputy GM Aviation Business, at Routes World 2023")


 in Kazakhstan - Exclusive Video Interview with Co-Founder, Auez Tulegenov")


")


, Hua Hin (หัวหิน), Prachuap Khiri Khan (ประจวบคีรีขันธ์), Cha-Am (ชะอำ) and Petchaburi (เพชรบุรี), to those living in Thailand as well as regional travellers and businesses.")
 has been described as 'an important enabler of Sabre’s vision for personalized travel'. But what exactly is NDC, and what role does Sabre play in its development and future growth? Those are just two of the questions that Steven Howard of TravelNewsAsia.com asks Kathy Morgan, Vice President - Offer Sourcing at Sabre Travel Solutions.")
 Conservation, Jungle Bubbles and Tourism in Thailand - Interview with John Roberts of the Golden Triangle Asian Elephant Foundation (GTAEF)")


 - State of the Industry 2020 with Subhas Menon, Director General")
, Thailand's Deputy Prime Minister and the Minister of Public Health and Dr. Tanarak Plipat, Deputy Director General of Thailand's Department of Disease Control speaking at the World Health Organisation's (WHO) COVID19 virtual press conference on 6 November 2020")


 does, as well as how the year 2019 ended and what they have planned for 2020. John tells us what Jungle Bubbles are, who is staying in them, how many elephants people can expect to see, whether they are safe, and how they plan to expand this rather unusual idea. All that and much, much more in the interview.")


 2020. Filmed at TAT's office in London on 8 January 2020, Khun Chiravadee tells us when and where TTM+ 2020 will take place, why that city was chosen, what the theme will be this year, and how many buyers and sellers are expected to attend. Khun Chiravadee tells us how many buyers from the UK will be going and how those buyers will be chosen, and much, much more.")


. Yanik tells us how the certification levels within NDC, such as Level 4 and @scale, differ from one another, why they are important, what needs to be done to go from one level to another, and so very much more.")

 in Bangkok, Steven Howard of TravelNewsAsia.com asks Robert to give us an update on the company, NDC, NGS and the industry in general.")


 Yangsuksathaporn, General Manager of the Vince Hotel Bangkok Pratunam. In this interview, filmed in the rooftop bar of the hotel on 1 November 2019, Khun Fah tells us about the location of the Vince Hotel Bangkok Pratunam, where the hotel's guests are coming from, how 2019 compares to 2018, what its USPs are, where all the creative ideas come from, which other events the hotel will attend this year, what guests can expect from the property and what plans they have for 2020. All that and much, much more in the FHD video and podcast.")


, Siem Reap (REP) and Sihanouk (KOS), how this year compares to last year, and what expansion plans they have for the future.")


, the Group Director - Travel Industry for Cape & Kantary Hotels, to ask him about the event and the company's plans for the future. In this exclusive interview, filmed at the Cape Panwa Hotel on 21 July 2019, Khun Tom tells us about three new properties the hotel group plans to open in the next few years, how they will be branded, where they will be located, and how many rooms each will have.")


 and has attended the last nine, including the most recent edition in Jomtien, Pattaya last week. In this exclusive interview, filmed on the first day of TTM+ 2019, Kati Hakkinen explains where Khanom is in Thailand, what its attraction is and what is the best way to travel there.")

 2019 in Pattaya. Steven Howard of TravelNewsAsia.com sat down with Khun Sillapat Watcharapong, Director of Marketing at the Racha Kiri Resort in Khanom, to ask him about his resort and Khanom as a destination.")

 2019, held in Jomtien, Pattaya last week, not only had the crucial buyers meet sellers component, but also different workshops with expert speakers sharing their knowledge with media and sellers alike. One such expert, Khun Arrut Navaraj, Managing Director of Suan Sampran, gave an interesting talk to delegates about Organic Farming and Sustainable Tourism.")
 in Pattaya. Mr. Tanes Petsuwan, TAT's Deputy Governor for Marketing Communications, used the media briefing to outline their plans for 2019 and beyond, and give some insight into which of Thailand's less well known destinations they will be promoting and how. This video includes the Q&A at the end.")

, in Halong, Vietnam on 26 May 2019.")


 as Miss USA. In this interview, filmed on 7 March 2019, Steven Howard asks Jazell why she has come so far to compete and why she chose Miss International Queen above all the others.")


, Managing Director of Phuket-based Sky Marine Group. In this interview, filmed at the Ocean Marina Pattaya Boat Show on 2 December 2018, Steven Howard asks Khun Thanaya about her business which includes yacht sales, hull cleaning and maintenance, as well as luxury yacht charters.")

 Song, Managing Vice President Passenger Network & Sales about the airline and its plans for the future.")

 62nd Assembly of Presidents.")


 and Sustainable Tourism - PHIST Interview. What could the World Wide Fund for Nature, or WWF as it is more commonly known, possibly have in common with the hotel industry? In this exclusive interview with Maggie Lee, Market Transformation Manager at WWF Singapore, we ask Maggie about this, and much more.")
 season and the peak November - May season.")


 forum which was held at the resort on 24 September.")


 in London.")
 at Farnborough Airshow 2018 on 16 July, Steven Howard of TravelNewsAsia.com asks Mr. Gauss about the aircraft, why it is so popular, what makes it special and what plans they have for future orders.")


 Province, Thailand.")