|
IATA has published the 58th edition of the World
Air Transport Statistics (WATS), a yearbook of the airline
industry�s annual performance containing extensive statistical
information and analysis.
�Commercial aviation began 100 years ago with a
single airplane, a single passenger and a single route. Last year,
as recorded in the WATS, the industry carried more than 3 billion
passengers and nearly 48 million tonnes of cargo on nearly 100,000
flights per day, while the real price of air travel fell by 7.4%.
Aviation�s annual contribution exceeds even these impressive
figures. Its global economic impact is estimated at $2.4 trillion
and it supports 3.4% of global GDP. By value, over a third of
goods traded internationally are delivered by air and some 58.1
million jobs are supported by aviation,� said Tony Tyler, IATA�s
Director General and CEO.
Snapshot of 2013
Industry Performance: Passenger
System-wide, airlines carried 3.129
billion passengers on scheduled services, an increase of 5.1% over
2012.
Airlines in the Asia Pacific region
carried the largest number of passengers of any region. The
regional ranking (based on total passengers carried on scheduled
services by airlines registered in that region) is:
1. Asia Pacific (1.012 billion passengers, an
increase of 9.3%)
2. Europe (825.9 million passengers, up 3.4%
over 2012)
3. North America (818.9 million, up 0.7% over 2012)
4. Latin America and the Caribbean (240.5 million, up 7.6% )
5.
Middle East (157.9 million, an increase of 8.8%)
6. Africa
(73.8 million, 5.6% up over 2012).
The top countries by region based on
passengers carried (total both-ways, international and domestic)
were:
1. Africa: South
Africa (20.4 million, a decline of 0.1% compared to 2012)
2.
Asia Pacific: People�s Republic of
China (404.2 million, an increase of 11.8%)
3.
Europe: United Kingdom (177.9
million, up 3.7% over 2012)
4. Latin
America and Caribbean: Brazil (92.9 million, an increase of
4.5% over 2012
5. Middle East:
United Arab Emirates (45.3 million, an increase of 11.7%),
6.
North America: United States (618.1
million, an increase of 3.3% over 2012).
The United States is still the largest
single air market in the world, in terms of total two-way traffic,
international and domestic.
The top five airlines ranked by total scheduled
passengers carried were:
1. Delta Air Lines (120.6 million)
2.
Southwest Airlines (115.3 million)
3. China Southern Airlines
(91.5 million)
4. United Airlines (90.2 million)
5. American
Airlines (86.8 million)
The top three city-pairs based on
passengers carried on international routes were:
1. Hong Kong-Chinese Taipei (4.9 million, down
11.5%)
2. Dublin-London (3.6 million, up 6.9%)
3.
Jakarta-Singapore (3.4 million, up 8.6%)
The top three city-pairs based on
passengers carried on domestic routes were:
1. Jeju-Seoul (9.58 million, up 1.4% over 2012)
2. Sapporo-Tokyo (9.17 million, up 4.7%)
3. Fukuoka-Tokyo
(8.34 million, up 9.3%)
Snapshot of 2013
Industry Performance: Cargo
Globally, cargo experienced weak growth
with freight tonne kilometers up only 1.8% compared to 2012.
However, this represents a reversal of the 1.1% shrinkage over
2011.
The top five airlines ranked by total scheduled
freight tonnes carried were:
1. Federal Express (7.1 million)
2. UPS
Airlines (4.1 million)
3. Emirates (2.1 million)
4. Korean
Air (1.4 million)
5. Cathay Pacific Airways (1.3 million)
Consumer and Business
Airlines added over 1,100 direct
airport-pair services and 600,000 frequencies in 2013, for a new
total of 50,000 direct airport-pair services and 31.5 million
frequencies.
The price of air travel in real terms fell
by 7.4% compared to 2012.
The cost of shipping goods by air in real
terms fell 7.1%.
Fuel
Fuel consumption represents about 2% of
all fossil fuels burned worldwide for all purposes, or about 12%
of the total amount of fossil fuels consumed by all
transportation. The average price of jet fuel in 2013 decreased by
3.9% compared to 2012.
Total estimated cost of fuel was $210 billion or
31% of airline operating costs.
Between 2005 and 2013, fuel efficiency improved
by 11%.
Airline Alliances
* Star Alliance maintained its position as the
largest airline alliance in 2013 with 26.6% of total scheduled
traffic (in revenue passenger kilometers), followed by SkyTeam
(20.1%) and oneworld (15.4%).
IATA,
Travel Trends
|

 Mandarin Oriental Opens Special Hotel in Beijing, China
 AirAsia to Launch Penang - Shenzhen and Kota Kinabalu - Shantou Flights
 Boeing Forecasts Passenger and Cargo Needs of China's Aviation Industry
 Air Corsica Takes Delivery of ATR's 1,700th Turboprop Aircraft
 Minor Hotels to Open Anantara Resort Ubud Bali in October
 Uruguayan Air Force to Add A-29 Super Tucano Aircraft to Fleet
 Air Astana to Increase Flights to Phuket, Thailand; Signs Codeshare Deal with JAL
 Hong Kong Airlines to Resume Long-Haul Flights with Seasonal Gold Coast Service
 IHG Signs Two Hotels in Quang Binh, Vietnam
 Marriott Opens Moxy Hotel in Mumbai, India
 Torsten Richter Returns to Minor Hotels as AGM of Indonesia and Malaysia
 Minor Set to Open World's Third NH Resort in Maldives
 Asiana Airlines and Air Serbia Appoint APG as GSA
 IndiGo to Launch New Delhi - Vijayawada Flights
 Hong Kong Airport Reports Strong Increases in Cargo and Passenger Traffic
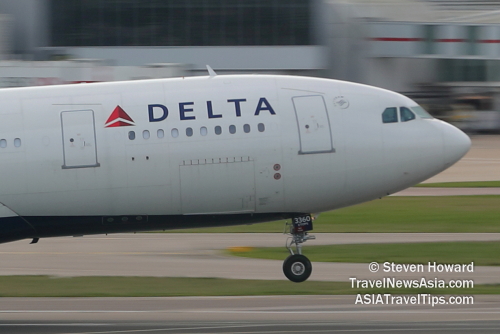 Delta Begins Rollout of Free Wi-Fi on Long-Haul International Routes
 Thai AirAsia X to Resume Flights Between Bangkok and Sydney, Australia
 Marriott Partners Sonder to Add Over 9,000 Rooms to Portfolio
 IHG Opens Hotel Indigo in Bandung, Indonesia
 IndiGo Enhances Operations with Aviobook, an Electronic Flight Folder from Thales
 Boeing Invests in Wagner SAF Refinery in Brisbane, Australia
 Aeroflot to Resume Flights Between Yekaterinburg and Bangkok, Phuket and Goa
 Air Astana Takes Delivery of 56th Aircraft; Confirms Plan to Launch Phu Quoc Flights
 Seibu Prince Rebrands Hotel in Singapore
 airBaltic Appoints APG as GSA in Egypt
 Korean Air and Delta Air Lines Partner Habitat for Humanity to Make a Difference in Cheonan
 Air New Zealand, Garuda, Qantas and Singapore Airlines Begin UPR Trials on 38 Routes
 Thai AirAsia Reports Q2 and H1 2024 Results; Confirms Full-Year Targets
 EL AL Israel Airlines Finalises Deal for 31 Aircraft
 Cebu Pacific to Launch Davao - Hong Kong and Iloilo - Singapore Flights
 Poland to Become Largest Operator of Apache Combat Helicopters Outside of USA
 Singha Estate Partners Ascott for Rebranding of Two Hotels in the United Kingdom
 Miss International Queen 2024 (MIQ 2024) - Interview with Alisa Phanthusak, MD, Tiffany's Show Pattaya, Thailand
 IndiGo to Launch Coimbatore - Singapore Flights; Increase Frequency of Select Services
 Parveen Kumar Joins Grand Hyatt Jakarta as General Manager
 Azerai Appoints Jimmy Tran as Group Director of Sales & Marketing
 South Korea to Strengthen Airborne Surveillance and Reconnaissance Capabilities
 Virgin Australia to Replace Fokker 100s with Embraer E190-E2 Aircraft
 Cross Adds Two Hotels in Bangkok, Thailand to Portfolio
 airBaltic Exercises Options on 10 Airbus A220-300 Aircraft
 Etihad to Increase Thailand Flights; Resume A380 Service to Singapore
 Dusit Signs Hotel and Condo on Rama 3 Road in Bangkok, Thailand
 Cape and Kantary Hotels to Expand Portfolio with Serviced Suites in Korat, Thailand
 Thai Airways Reports Q2 and H1 2024 Results
 China Airlines Extends Cargo Handling Contract with FCS
 Goldfinch Becomes First Piloted Electric Aircraft to Fly at NASA's Langley Research Center
 Rosewood Signs Luxury 33-Suite Resort in Exuma, Bahamas
 British Airways Expands Codeshare with Bangkok Airways
 Aeroflot Unveils Most Popular International Destinations in H1 2024
 Marriott Executive Apartments Open on Sukhumvit Soi 49 in Bangkok, Thailand
 Uday Rao Appointed RVP and GM of Four Seasons Hotel Tokyo at Otemachi in Japan
 CapitaLand Ascott Trust Secures OCBC 1.5°C Loan
 Sabre Hospitality Enhances SynXis Booking Engine with Trip Protection Services
 Cathay Pacific Orders 30 Airbus A330-900 Aircraft
 Haytham Said Appointed GM of Four Seasons Hotel Miami
 Hong Kong Airport Launches World's First Smartphone Express Bag Drop Service
 Marriott Signs W Hotel in Hangzhou, China
 IndiGo Selects Recaro's R2 and R5 Seats for New A321neo Aircraft
 Scoot to Take Delivery of Jalan-Jalan and Travel Kaki E190-E2s in September and October
 Ali Mohammed Appointed Regional Vice President and GM of Four Seasons Resort Orlando
 Marriott Opens Fourth Executive Apartments Property in Bangkok, Thailand
 AirAsia X to Resume Kuala Lumpur - Chongqing Flights
 Norse Operates Non-Stop Charter Flight from Oslo to Darwin, Australia
 Wyndham Reports Record H1 Growth in Asia Pacific
 LOT Polish Airlines Takes Delivery of First Embraer E195-E2
 Vietnam Airlines Takes Delivery of Fifth Boeing 787-10 Aircraft
 Marriott Expands Executive Apartments Brand to Penang, Malaysia
 AirAsia Group Expands Fleet with Four Airbus A321neo Aircraft
 IATA Reports Latest Airline Passenger Traffic Data
 China Airlines Signs SAF-Related MOU with Morrison Express
 Fairfield by Marriott Hotel Opens in Terengganu, Malaysia
 IATA Reports Latest Global Air Cargo Data
 Marriott Opens Fifth Autograph Collection Hotel in Japan
 Matthew Smith to Succeed Monique Arnoux as CEO of Destination Asia
 American Airlines Renews Subscription to Prism
 Shanghai Pudong Airport Installs 52 Kiosks and 14 Self-Service Bag Drops from SITA
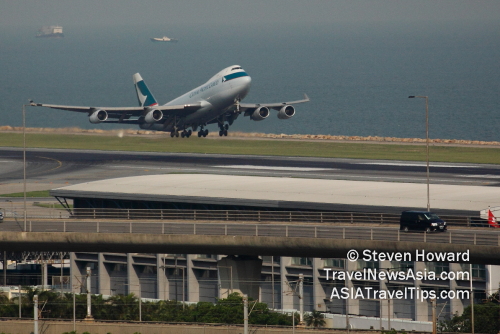 Hong Kong Airport Handled 4.3 Million Passengers and 29,590 Flight Movements in June
 Croatia Airlines Takes Delivery of First Airbus A220
 Ryanair to Implement Boeing's Jeppesen FliteDeck Pro 5.0 EFB
 Asia Pacific Airlines Carried 28.9 Million International Passengers in June
 Singapore Changi Airport Reports Q2 2024 Traffic
 Cat Wu Returns to Singapore as Executive Director of Revenue for Two Hotels
 Langham Appoints Jack Xiao as Senior Vice President of Operations - China
 NATO Selects Sikorsky X2 Rotorcraft for Integrated Platform Concept Study
 Malaysia Airlines Expands Retailing Strategy with NDC Content on Travelport
 Air Tahiti Orders Four ATR 72-600 Aircraft
 One Air to Expand Fleet with Third Boeing 747-400 Freighter
 FCM Travel Expands Cytric Distribution Agreement with Amadeus
 Cathay Pacific Expands 1 Ticket, 1 Tree Initiative to Include Cargo
 Japan Airlines Confirms Order for 20 Airbus A350-900s and 11 A321neos
 Embraer E190 Freighter Receives ANAC Type Certification
 Libya's Berniq Airways Orders Six A320neo Family Aircraft
 Qatar Airways Adds 20 Boeing 777-9s to Order Book
 Accor Signs Raffles Hotel in Tokyo, Japan
 Thai AirAsia to Launch Bangkok - Hyderabad and Phuket - Siem Reap Flights
 Courtyard by Marriott Hotel Opens in Sapporo, Japan
 Qatar Airways Unveils Qsuite Next Gen at Farnborough Airshow 2024
 British Airways Increases Number of Funded Places in Speedbird Pilot Academy
 Mandarin Oriental Signs Hotel and Residences in Bali, Indonesia
 Minor Hotels Signs Dual-Branded Property in Yining, China
 Korean Air Takes Delivery of First Boeing 787-10 Dreamliner
 Two Senior Promotions at IHG Asia Pacific
 Airbus A321XLR Powered by CFM LEAP-1A Engines Receives EASA Type Certification
 New Dusit Thani Bangkok Hotel to Open 27 September 2024
 CWT Upgrades Airfare Optimization Service with AI and Machine Learning
 Small Luxury Hotels of the World Returns to India with MRS Group Partnership
 SATS and SF Group Sign MOU to Expand Global Footprint
 Thai AirAsia to Launch Don Mueang - Lampang Flights
 Hong Kong Welcomed 3.13 Million Visitor Arrivals in June 2024
 China Airlines Launches Direct Flights Between Taipei and Seattle, USA
 London Heathrow Airport Expands Partnership with SITA
 bp Partners Audi Formula 1 Team
 High-Speed Fun in Denmark! HD Video Interview with Aarhus Sea Rangers
 16 Exclusive HD Video Interviews from Routes Europe 2024 in Aarhus, Denmark
 9 Exclusive HD Video Interviews from Routes Asia 2024 in Langkawi, Malaysia
 9 Exclusive Video Interviews with VIPs at ASEAN Tourism Forum 2024 in Vientiane, Laos
 8 NTO Press Conferences from the ASEAN Tourism Forum 2024 in Vientiane, Laos
 13 Exclusive HD Video Interviews with VIPs at World Travel Market 2023 in London, England
 5 HD Video Interviews from APG World Connect 2023 in Monaco, France
 15 Exclusive Videos from Routes World 2023 in Istanbul, Türkiye
 - Interview with Alisa Phanthusak, MD, Tiffany's Show Pattaya, Thailand")

 Central Poland - Interview with Robert Makowski, Commercial Director (CCO)")

, Southampton (SOU) and Aberdeen Airports (ABZ) - Interview with Christopher Tibbett, Aviation Director")

 in Denmark - Interview with Lotta Sandsgaard, CEO, at Routes Europe 2024")


 - Interview with Prof. Dr. Martin Roll, CEO, at Routes Europe 2024")
 - Interview with Michiel Parent, Commercial Director")
 - Interview with Marc Watkins, RDM")
 in Estonia - Interview with Eero Pärgmäe Board Member and CCO")
 - Interview with Gary Cobb, Airport Director")


 in Western Australia - Interview with Stephanie Juszkiewicz, SVP Aviation Business Development, at Routes Asia 2024 in Langkawi, Malaysia")
 Rayong / Pattaya, Thailand - Interview with Ampika Chadawong, at Routes Asia 2024 in Langkawi, Malaysia")
 in Nha Trang, Vietnam - Interview with Le Thi Hong Minh at Routes Asia 2024 in Langkawi, Malaysia")


 - Interview with Simon Miller, Senior Manager Market Intelligence, at Routes Asia 2024 in Langkawi, Malaysia")


 at ATF 2024")


 2024 in Vientiane, Laos")


 to Rebrand as DTH Travel - HD Video Interview with Stephan Roemer, Partner and Group CEO")

 - HD Video Interview with Rohan A. Khaunte, Minister for Tourism at WTMLDN 2023")

 Tourism - Interview with Prateek Hira, President & CEO of Tornos, at WTMLDN 2023")

 - Interview with Sheo Shekhar Shukla, Principal Secretary Culture & Tourism, at WTMLDN 2023")
 - Interview with Dr. Rashmi Sharma, Director - Department of Tourism, at WTMLDN 2023")
 2023")


.")


 of Malaysia Tourism Promotion Board (MTPB), at Routes World 2023 in Istanbul, Türkiye.")
 at Routes World 2023 in Istanbul, Türkiye.")

 - Interview with Ulla Lettijeff, SVP and Director (Finavia), at Routes World 2023")
 New Satellite Terminal - Airports of Thailand Interview with Paweena Jariyathitipong, Senior Executive Vice President (Engineering and Construction), by Steven Howard of TravelNewsAsia.com on 15 October 2023 at Routes World 2023 in Istanbul, Turkiye.")

 - Interview with Qiang Wang, Deputy GM Aviation Business, at Routes World 2023")


 in Kazakhstan - Exclusive Video Interview with Co-Founder, Auez Tulegenov")


")


, Hua Hin (หัวหิน), Prachuap Khiri Khan (ประจวบคีรีขันธ์), Cha-Am (ชะอำ) and Petchaburi (เพชรบุรี), to those living in Thailand as well as regional travellers and businesses.")
 has been described as 'an important enabler of Sabre’s vision for personalized travel'. But what exactly is NDC, and what role does Sabre play in its development and future growth? Those are just two of the questions that Steven Howard of TravelNewsAsia.com asks Kathy Morgan, Vice President - Offer Sourcing at Sabre Travel Solutions.")
 Conservation, Jungle Bubbles and Tourism in Thailand - Interview with John Roberts of the Golden Triangle Asian Elephant Foundation (GTAEF)")


 - State of the Industry 2020 with Subhas Menon, Director General")
, Thailand's Deputy Prime Minister and the Minister of Public Health and Dr. Tanarak Plipat, Deputy Director General of Thailand's Department of Disease Control speaking at the World Health Organisation's (WHO) COVID19 virtual press conference on 6 November 2020")


 does, as well as how the year 2019 ended and what they have planned for 2020. John tells us what Jungle Bubbles are, who is staying in them, how many elephants people can expect to see, whether they are safe, and how they plan to expand this rather unusual idea. All that and much, much more in the interview.")


 2020. Filmed at TAT's office in London on 8 January 2020, Khun Chiravadee tells us when and where TTM+ 2020 will take place, why that city was chosen, what the theme will be this year, and how many buyers and sellers are expected to attend. Khun Chiravadee tells us how many buyers from the UK will be going and how those buyers will be chosen, and much, much more.")


. Yanik tells us how the certification levels within NDC, such as Level 4 and @scale, differ from one another, why they are important, what needs to be done to go from one level to another, and so very much more.")

 in Bangkok, Steven Howard of TravelNewsAsia.com asks Robert to give us an update on the company, NDC, NGS and the industry in general.")


 Yangsuksathaporn, General Manager of the Vince Hotel Bangkok Pratunam. In this interview, filmed in the rooftop bar of the hotel on 1 November 2019, Khun Fah tells us about the location of the Vince Hotel Bangkok Pratunam, where the hotel's guests are coming from, how 2019 compares to 2018, what its USPs are, where all the creative ideas come from, which other events the hotel will attend this year, what guests can expect from the property and what plans they have for 2020. All that and much, much more in the FHD video and podcast.")


, Siem Reap (REP) and Sihanouk (KOS), how this year compares to last year, and what expansion plans they have for the future.")


, the Group Director - Travel Industry for Cape & Kantary Hotels, to ask him about the event and the company's plans for the future. In this exclusive interview, filmed at the Cape Panwa Hotel on 21 July 2019, Khun Tom tells us about three new properties the hotel group plans to open in the next few years, how they will be branded, where they will be located, and how many rooms each will have.")


 and has attended the last nine, including the most recent edition in Jomtien, Pattaya last week. In this exclusive interview, filmed on the first day of TTM+ 2019, Kati Hakkinen explains where Khanom is in Thailand, what its attraction is and what is the best way to travel there.")

 2019 in Pattaya. Steven Howard of TravelNewsAsia.com sat down with Khun Sillapat Watcharapong, Director of Marketing at the Racha Kiri Resort in Khanom, to ask him about his resort and Khanom as a destination.")

 2019, held in Jomtien, Pattaya last week, not only had the crucial buyers meet sellers component, but also different workshops with expert speakers sharing their knowledge with media and sellers alike. One such expert, Khun Arrut Navaraj, Managing Director of Suan Sampran, gave an interesting talk to delegates about Organic Farming and Sustainable Tourism.")
 in Pattaya. Mr. Tanes Petsuwan, TAT's Deputy Governor for Marketing Communications, used the media briefing to outline their plans for 2019 and beyond, and give some insight into which of Thailand's less well known destinations they will be promoting and how. This video includes the Q&A at the end.")

, in Halong, Vietnam on 26 May 2019.")


 as Miss USA. In this interview, filmed on 7 March 2019, Steven Howard asks Jazell why she has come so far to compete and why she chose Miss International Queen above all the others.")


, Managing Director of Phuket-based Sky Marine Group. In this interview, filmed at the Ocean Marina Pattaya Boat Show on 2 December 2018, Steven Howard asks Khun Thanaya about her business which includes yacht sales, hull cleaning and maintenance, as well as luxury yacht charters.")

 Song, Managing Vice President Passenger Network & Sales about the airline and its plans for the future.")

 62nd Assembly of Presidents.")


 and Sustainable Tourism - PHIST Interview. What could the World Wide Fund for Nature, or WWF as it is more commonly known, possibly have in common with the hotel industry? In this exclusive interview with Maggie Lee, Market Transformation Manager at WWF Singapore, we ask Maggie about this, and much more.")
 season and the peak November - May season.")


 forum which was held at the resort on 24 September.")


 in London.")
 at Farnborough Airshow 2018 on 16 July, Steven Howard of TravelNewsAsia.com asks Mr. Gauss about the aircraft, why it is so popular, what makes it special and what plans they have for future orders.")


 Province, Thailand.")